What OEE actually measures (and what it doesn't)
If you run a plant, you have a gut feel for how production is going: "this week was solid", "Tuesday was a disaster". The problem is that feelings don't pay the bills. OEE turns that gut feel into a comparable number, shift to shift.
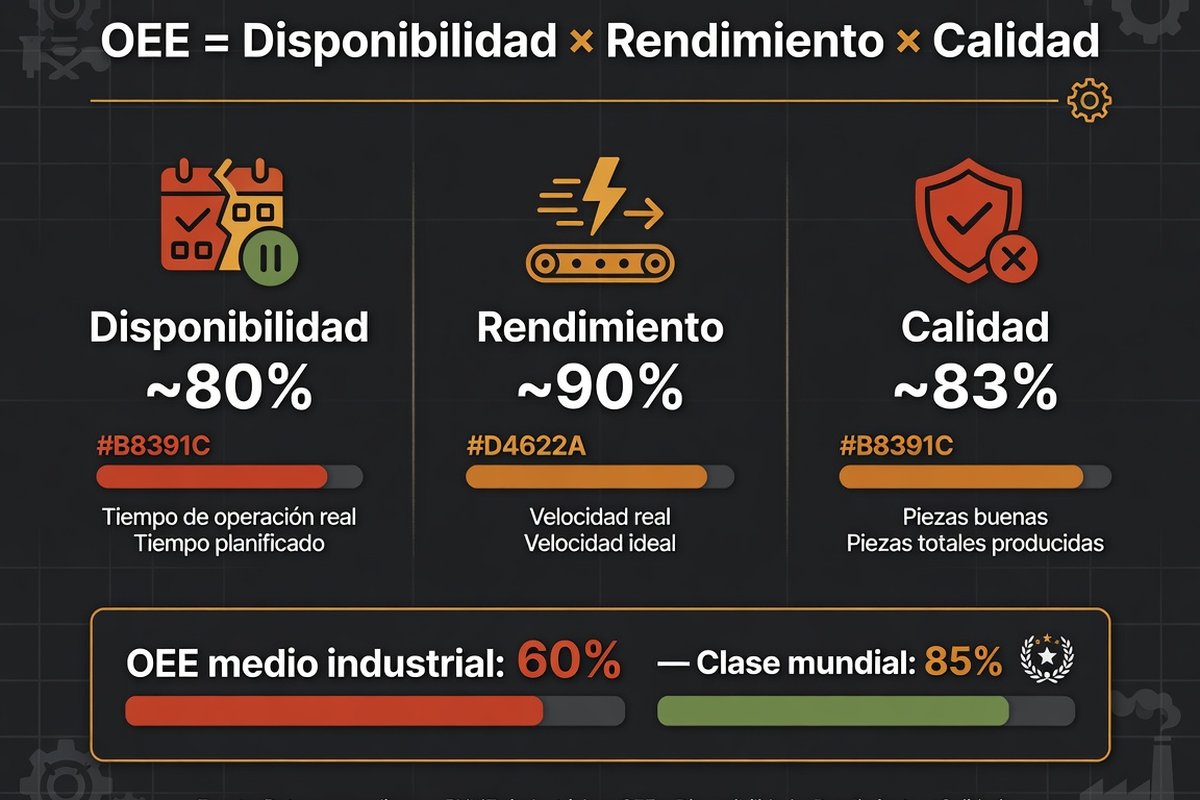
The formula is simple: OEE = Availability × Performance × Quality. Three questions:
- Availability: Was the machine running when it should have been? Breakdowns, changeovers, and material waits all damage this.
- Performance: Did it run at its actual designed speed? Micro-stops and slowdowns erode this silently.
- Quality: How many parts passed on the first run? Scrap and rework reduce this.
A concrete example. A line with 92% availability, 85% performance, and 98% quality has an OEE of 0.92 × 0.85 × 0.98 = 76.6%. Each factor looks decent on its own. Multiply them together, and you see you're leaving nearly a quarter of your capacity on the table. That's the power of the formula: it doesn't average, it multiplies.
How to calculate it step by step with a real shift
Imagine an 8-hour shift (480 minutes) on a machining line. You subtract 30 minutes of planned maintenance: your scheduled time is 450 minutes.
Step 1 – Availability. During the shift there was one 35-minute breakdown and two tool changeovers at 20 minutes each. Operating time: 450 − 75 = 375 minutes. Availability = 375 ÷ 450 = 83.3%. Note: planned maintenance is excluded from this calculation; unplanned stops are not.
Step 2 – Performance. The machine theoretically runs at 2 parts per minute. In 375 operating minutes, it should produce 750 parts. It produced 640. Performance = 640 ÷ 750 = 85.3%. Use the machine's demonstrated real-world speed, not the manufacturer's spec sheet. If you calculate against a theoretical maximum the machine never reaches, the number comes out artificially low and demoralizes everyone.
Step 3 – Quality. Of the 640 parts, 19 went to scrap or rework. Quality = 621 ÷ 640 = 97%.
OEE for the shift: 0.833 × 0.853 × 0.97 = 68.9%. If your production hour is worth €200, that shift lost roughly €465 in potential capacity. Multiply by two shifts, five days, forty-eight weeks, and you understand why this number matters more than almost any other plant KPI.
Why your hand-logged OEE is lying to you
Here's the uncomfortable part. According to Overtel data, when a factory switches from manual logging to automated data capture, real OEE typically surfaces 10–20 points below the estimate. A documented case from automotive: paper logs showed 92% availability; sensors showed 78%. Fourteen points of difference that cost roughly $420,000 a year.
The three classic gaps:
Micro-stops don't exist on paper. Five tool adjustments of 8 minutes each per shift add up to 40 minutes of downtime. The operator doesn't log it because "it wasn't a real stop". On many lines, these short pauses account for 20–30% of total lost time. A 2023 plant maintenance survey found that equipment using paper or spreadsheets is 3.7 times more likely to miss losses under 15 minutes.
Ideal speed is science fiction. If your machine can theoretically run 100 units per minute but has run at 85 for years, and you calculate performance against 100, your metric swings by 17%. In the wrong direction: it tells you the problem is speed when the real bottleneck might be downtime.
Rework masquerades as good output. If 15 out of 100 parts need rework and you count all 100 as good, your quality factor is inflated by 15%. A metal fabricator discovered that their "88% quality" was actually a 22% loss once they counted rework time and scrap management.
"70% of industrial SMBs still run shift logs on paper, then someone manually enters them into Excel. Result: data that's cold, 24 hours old, and decisions made while looking in the rear-view mirror."
iGromi, OEE Calculation Guide, 2026How to get started this week without buying anything
You don't need an MES to make the first move. You need discipline and a spreadsheet with four columns per shift: planned time, unplanned downtime in minutes (with cause), total parts, defective parts. That's enough to calculate all three factors.
Two rules to keep it alive past two months (which is what kills most attempts):
First: standardize downtime causes with a closed list. If Operator A writes "motor failure", Operator B writes "motor broken", and Operator C writes "mtr fld", you'll never build a Pareto analysis. Fixed dropdown list, period.
Second: start with one line, the one that hurts most. McKinsey estimates 70% of OEE initiatives stall before 18 months, almost always because teams try to measure everything at once. Run a pilot on one line, target one loss type, and see results in weeks. At a beverage plant, operators themselves created a visual checklist that cut quality losses 22% in the pilot's first week.
Most plants measuring for the first time discover an OEE 8–12 points lower than they thought they had. Don't panic at that first number: that ugly data is your starting point, not a verdict.
When to move from Excel and automate capture
Excel gets you building a data culture. But eventually it becomes the bottleneck. Watch for these signs:
- You spend more than 4 hours a week manually transcribing logs.
- You need to know if the machine is down now, not tomorrow in the report.
- You suspect downtime logs don't match reality.
- You're tracking more than 3 critical machines at the same time.
The good news: the barrier to entry has collapsed. An IoT sensor to connect a legacy machine costs €50–500 today, and modern PLCs with OPC-UA integrate directly without reprogramming. This isn't a six-figure project with a year of deployment anymore: 40-person SMBs are now rolling out OEE monitoring in 30 days, starting with their 3 highest-impact machines.
The return is just napkin math: if your production hour is worth €2,000 and you capture 5 points of OEE, that's over €50,000 a month in recovered capacity. No new machinery required. It's the same logic we apply to predictive maintenance: the money isn't in new iron, it's in squeezing what you already own.
If your plant is in Galicia, this kind of digitalization project also fits the Igape grants for industrial automation, which can cover a significant portion of sensor and software investment.
One caveat: don't trick yourself with TEEP
A detail almost nobody mentions. OEE is calculated over planned production time. If you run a single 8-hour shift and your OEE is 90%, congrats — but your machine sits idle 16 hours a day. The metric that exposes this is TEEP (Total Effective Equipment Performance): OEE × utilization across all 24 hours. A machine with 90% OEE running one shift has a TEEP of just 30%.
Does this mean you need to go three-shift? Not necessarily. It means before you invest in another machine because "we're maxed out", look first at how much dormant capacity you have in the equipment you already paid for. More than one plant expansion has been avoided with this calculation.
Frequently asked questions
What counts as good OEE for an industrial SMB?
Industrial average is around 60%. An 85% OEE is considered world-class. If you're below 40%, that's not bad news — it's massive upside you can capture without buying new machinery.
Do I need an MES system to measure OEE?
Not to get started. Launch with a well-structured spreadsheet and disciplined downtime logging. When you're spending more than 4 hours per week entering data by hand or you need real-time plant visibility, then automate capture with IoT sensors, which now cost €50–500 per machine.
Why does my hand-calculated OEE look better than the real number?
Three reasons: micro-stops under 15 minutes don't get logged, performance is calculated against theoretical speeds instead of actual, and rework gets counted as good output. Manual logging typically inflates OEE by 10–20 points.
Want to know your plant's real OEE?
We'll help you set up measurement: from the initial spreadsheet to automated capture with connected sensors feeding a real-time dashboard. We start with one line, using your numbers, no grand projects.
Measure my plant's OEE →